10 Key Customer Service Metrics You Must Track in 2026
Created: 14/01/2026

Customer service teams generate mountains of data every day. But if you're not tracking the right metrics, you're flying blind.
I've worked with teams that obsessed over vanity metrics while their actual customer experience crumbled. The trick is focusing on numbers that tell you what's really happening with your customers and your team's performance.
Here are ten metrics that matter in 2026, why they're important, and what good performance looks like.
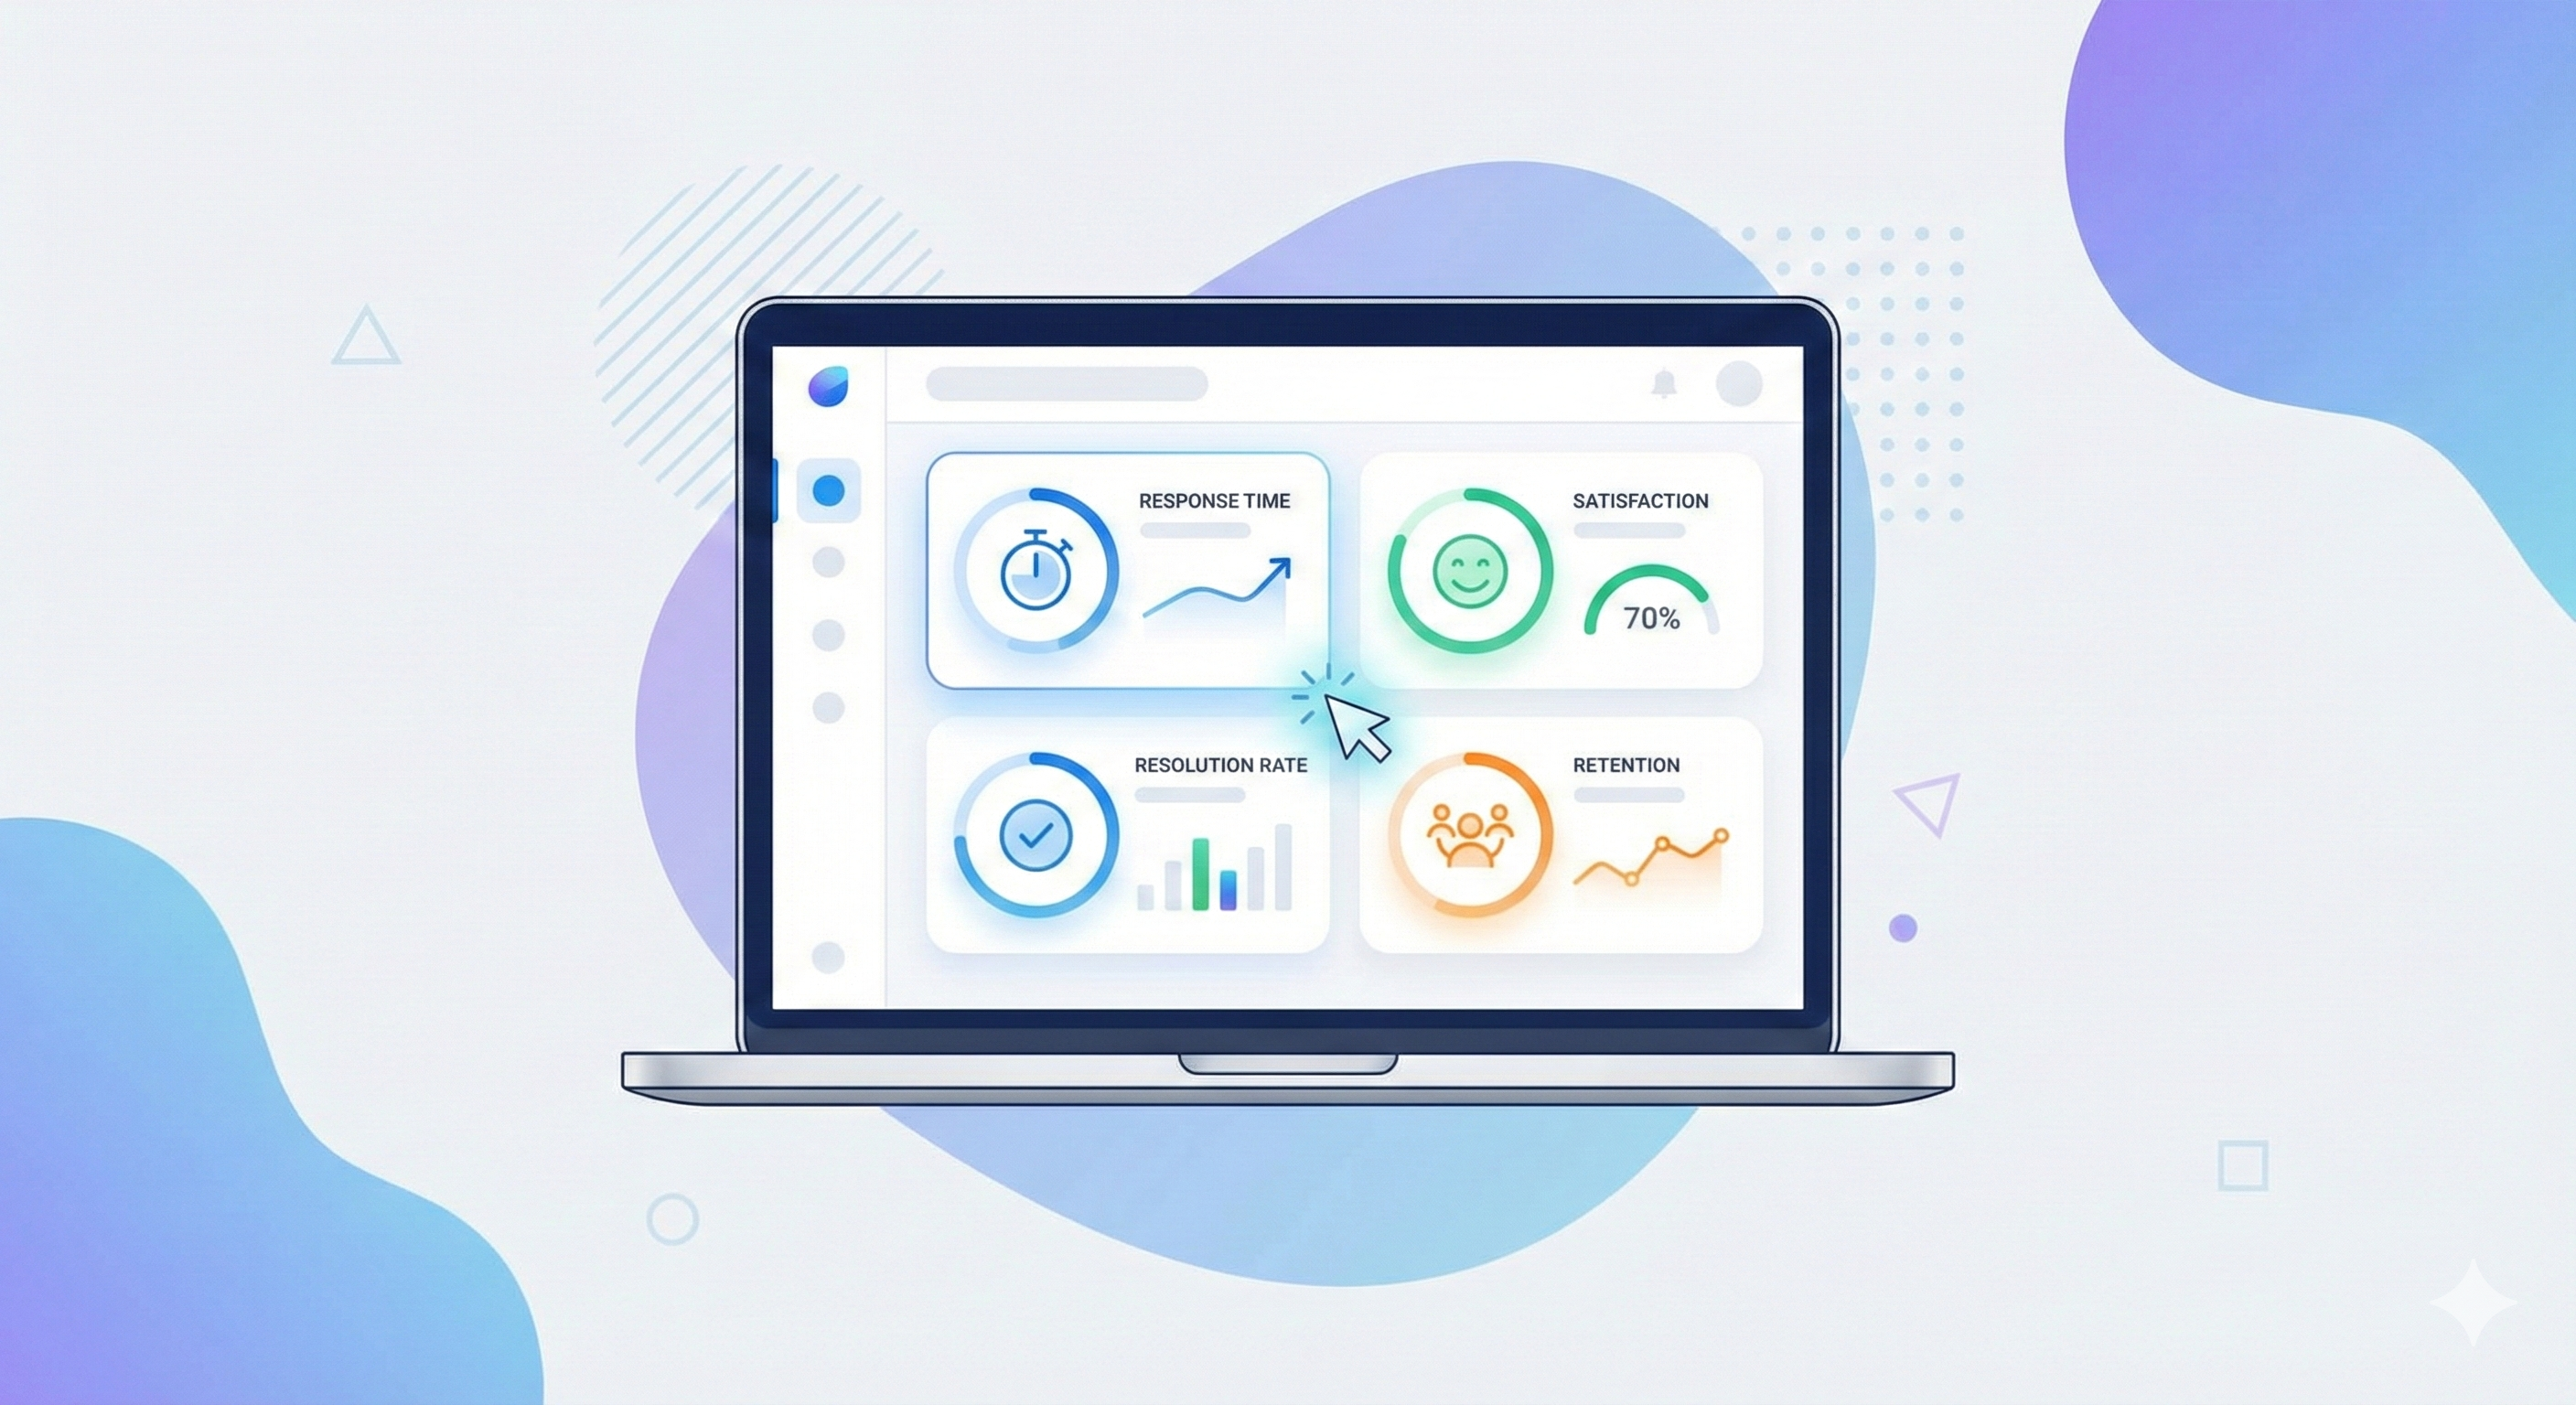
Turn Customer Service Data Into Insights
Set up simple tracking and see how customer service performance improves over time.
1. First Response Time (FRT)
This measures how long it takes for a customer to get their first reply after reaching out.
Speed matters. When someone contacts support, they're stuck. They can't complete a purchase, can't use your product, or something broke. Every minute they wait is a minute they're frustrated.
What good looks like: Email should be under 2 hours. Live chat under 2 minutes. Social media under 1 hour.
Track this by channel because expectations vary. Nobody expects instant email replies, but chat is different.
How to improve it: Add chatbots for initial triage. Create templates for common questions. Staff your team based on ticket volume patterns, not guesswork.

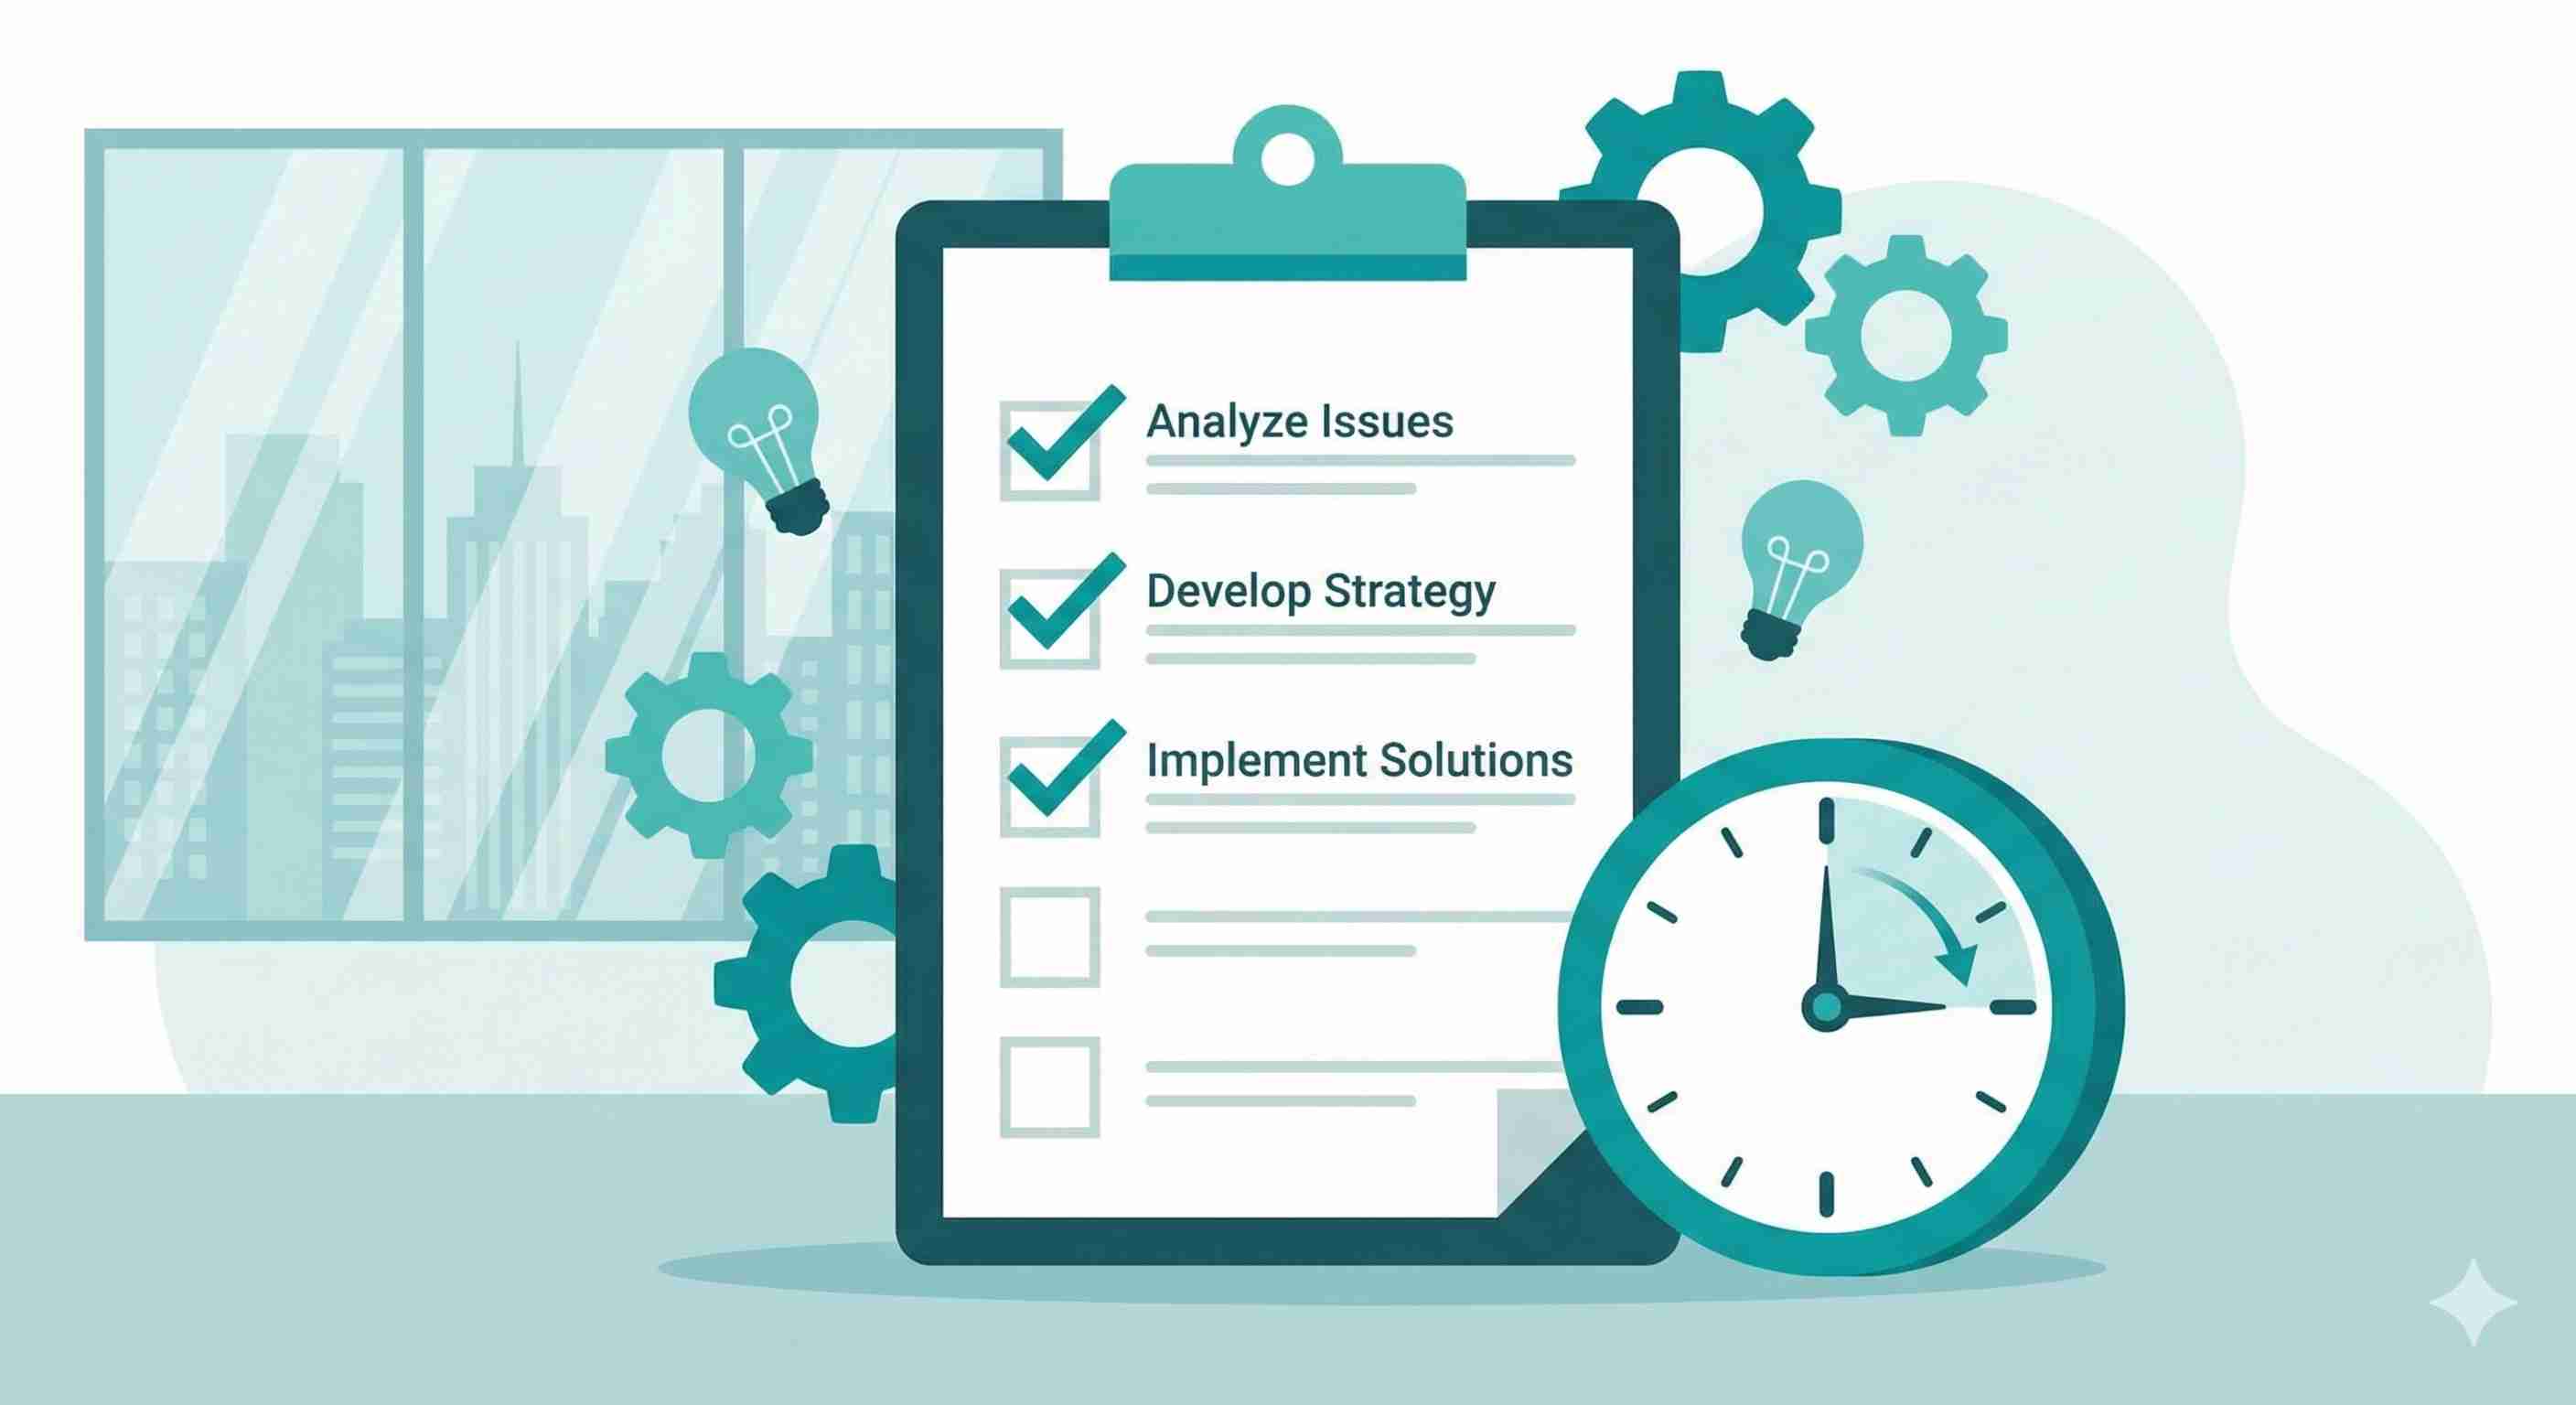
2. Average Resolution Time
This tells you how long it takes to completely solve a customer's problem from first contact to closure.
First response time gets you points for speed. Resolution time shows whether you actually fixed the issue.
Some companies game their FRT by sending quick but useless responses. Don't do that. But don't let tickets drag on forever either.
What good looks like: Simple issues should close in under 24 hours. Complex technical problems might take 3-5 days. Anything past a week needs escalation.
How to improve it: Build a solid knowledge base so agents find answers faster. Create clear escalation paths. Track where tickets get stuck and fix those bottlenecks.
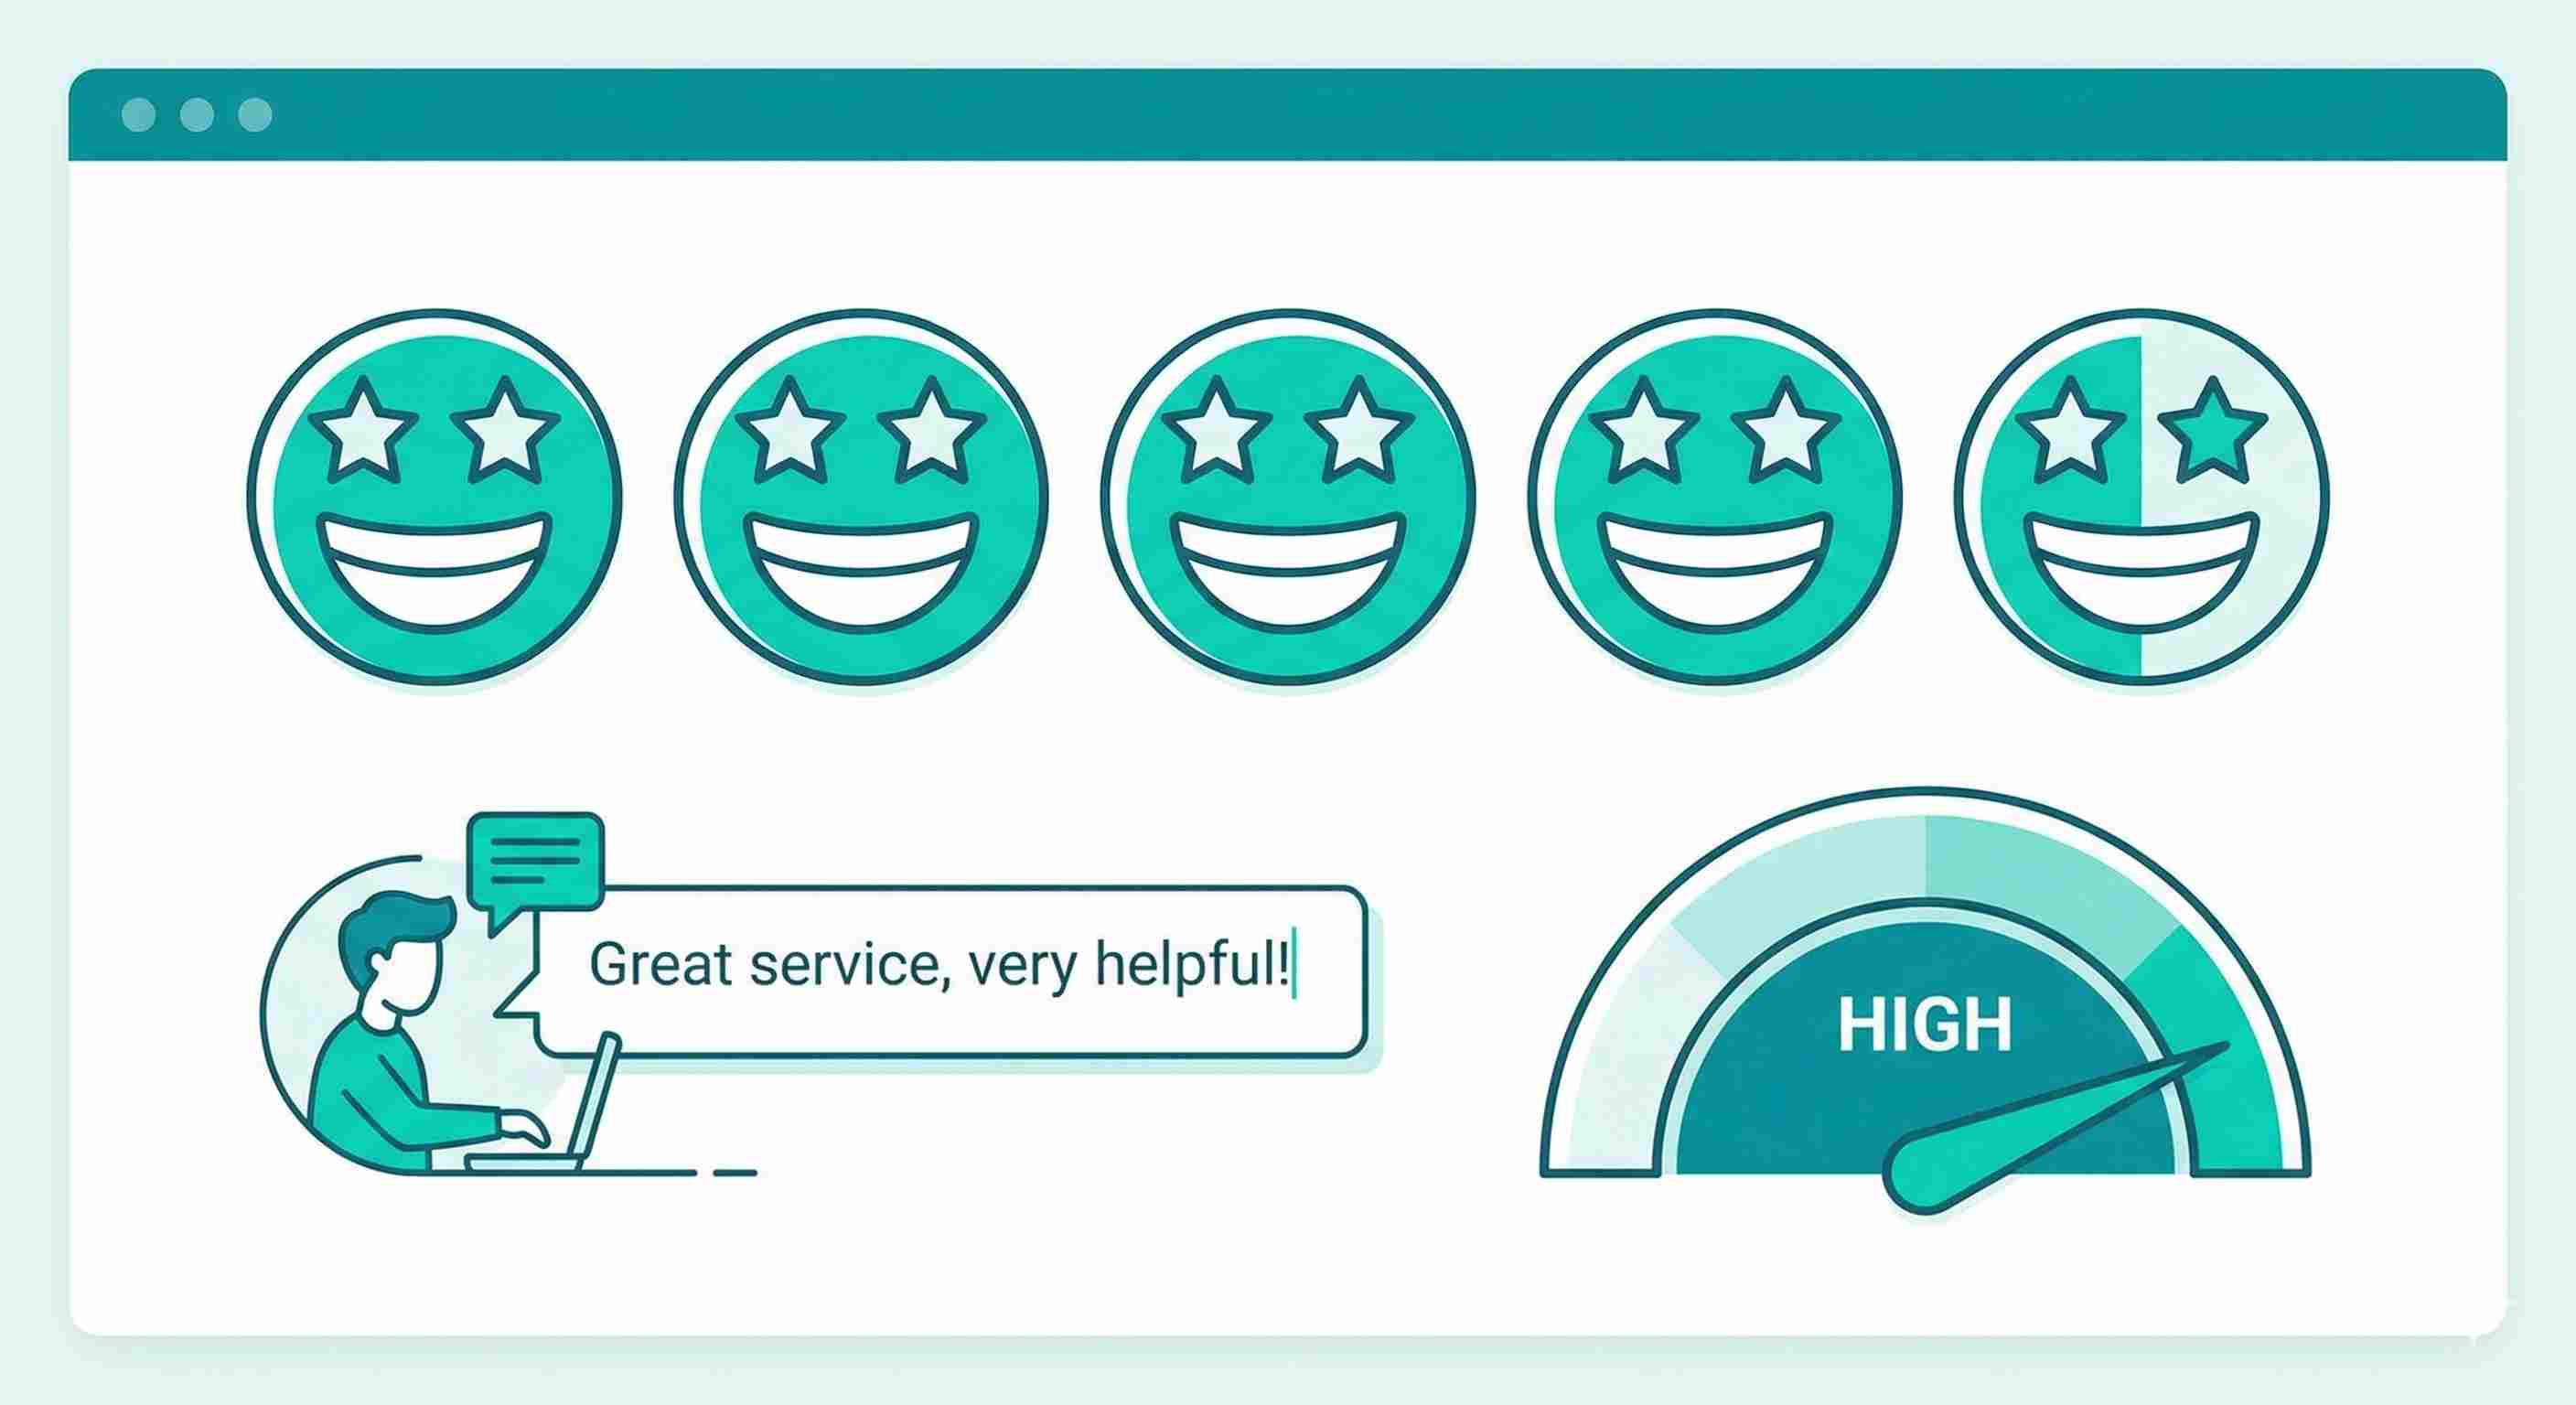
3. Customer Satisfaction Score (CSAT)
This is the simple "How satisfied were you with your support experience?" question, usually rated 1-5 or with emoji reactions.
CSAT tells you if customers felt helped. You can track it per agent, per channel, per issue type. That granularity makes it useful.
What good looks like: Aim for 85% or higher giving you a 4 or 5. Anything below 80% means you have serious problems.
How to improve it: Send the survey immediately after ticket closure while the experience is fresh. Read the comments, not just the scores. Patterns emerge quickly.
If your CSAT tanks on a specific issue type, maybe your documentation is unclear or your product has a bug.
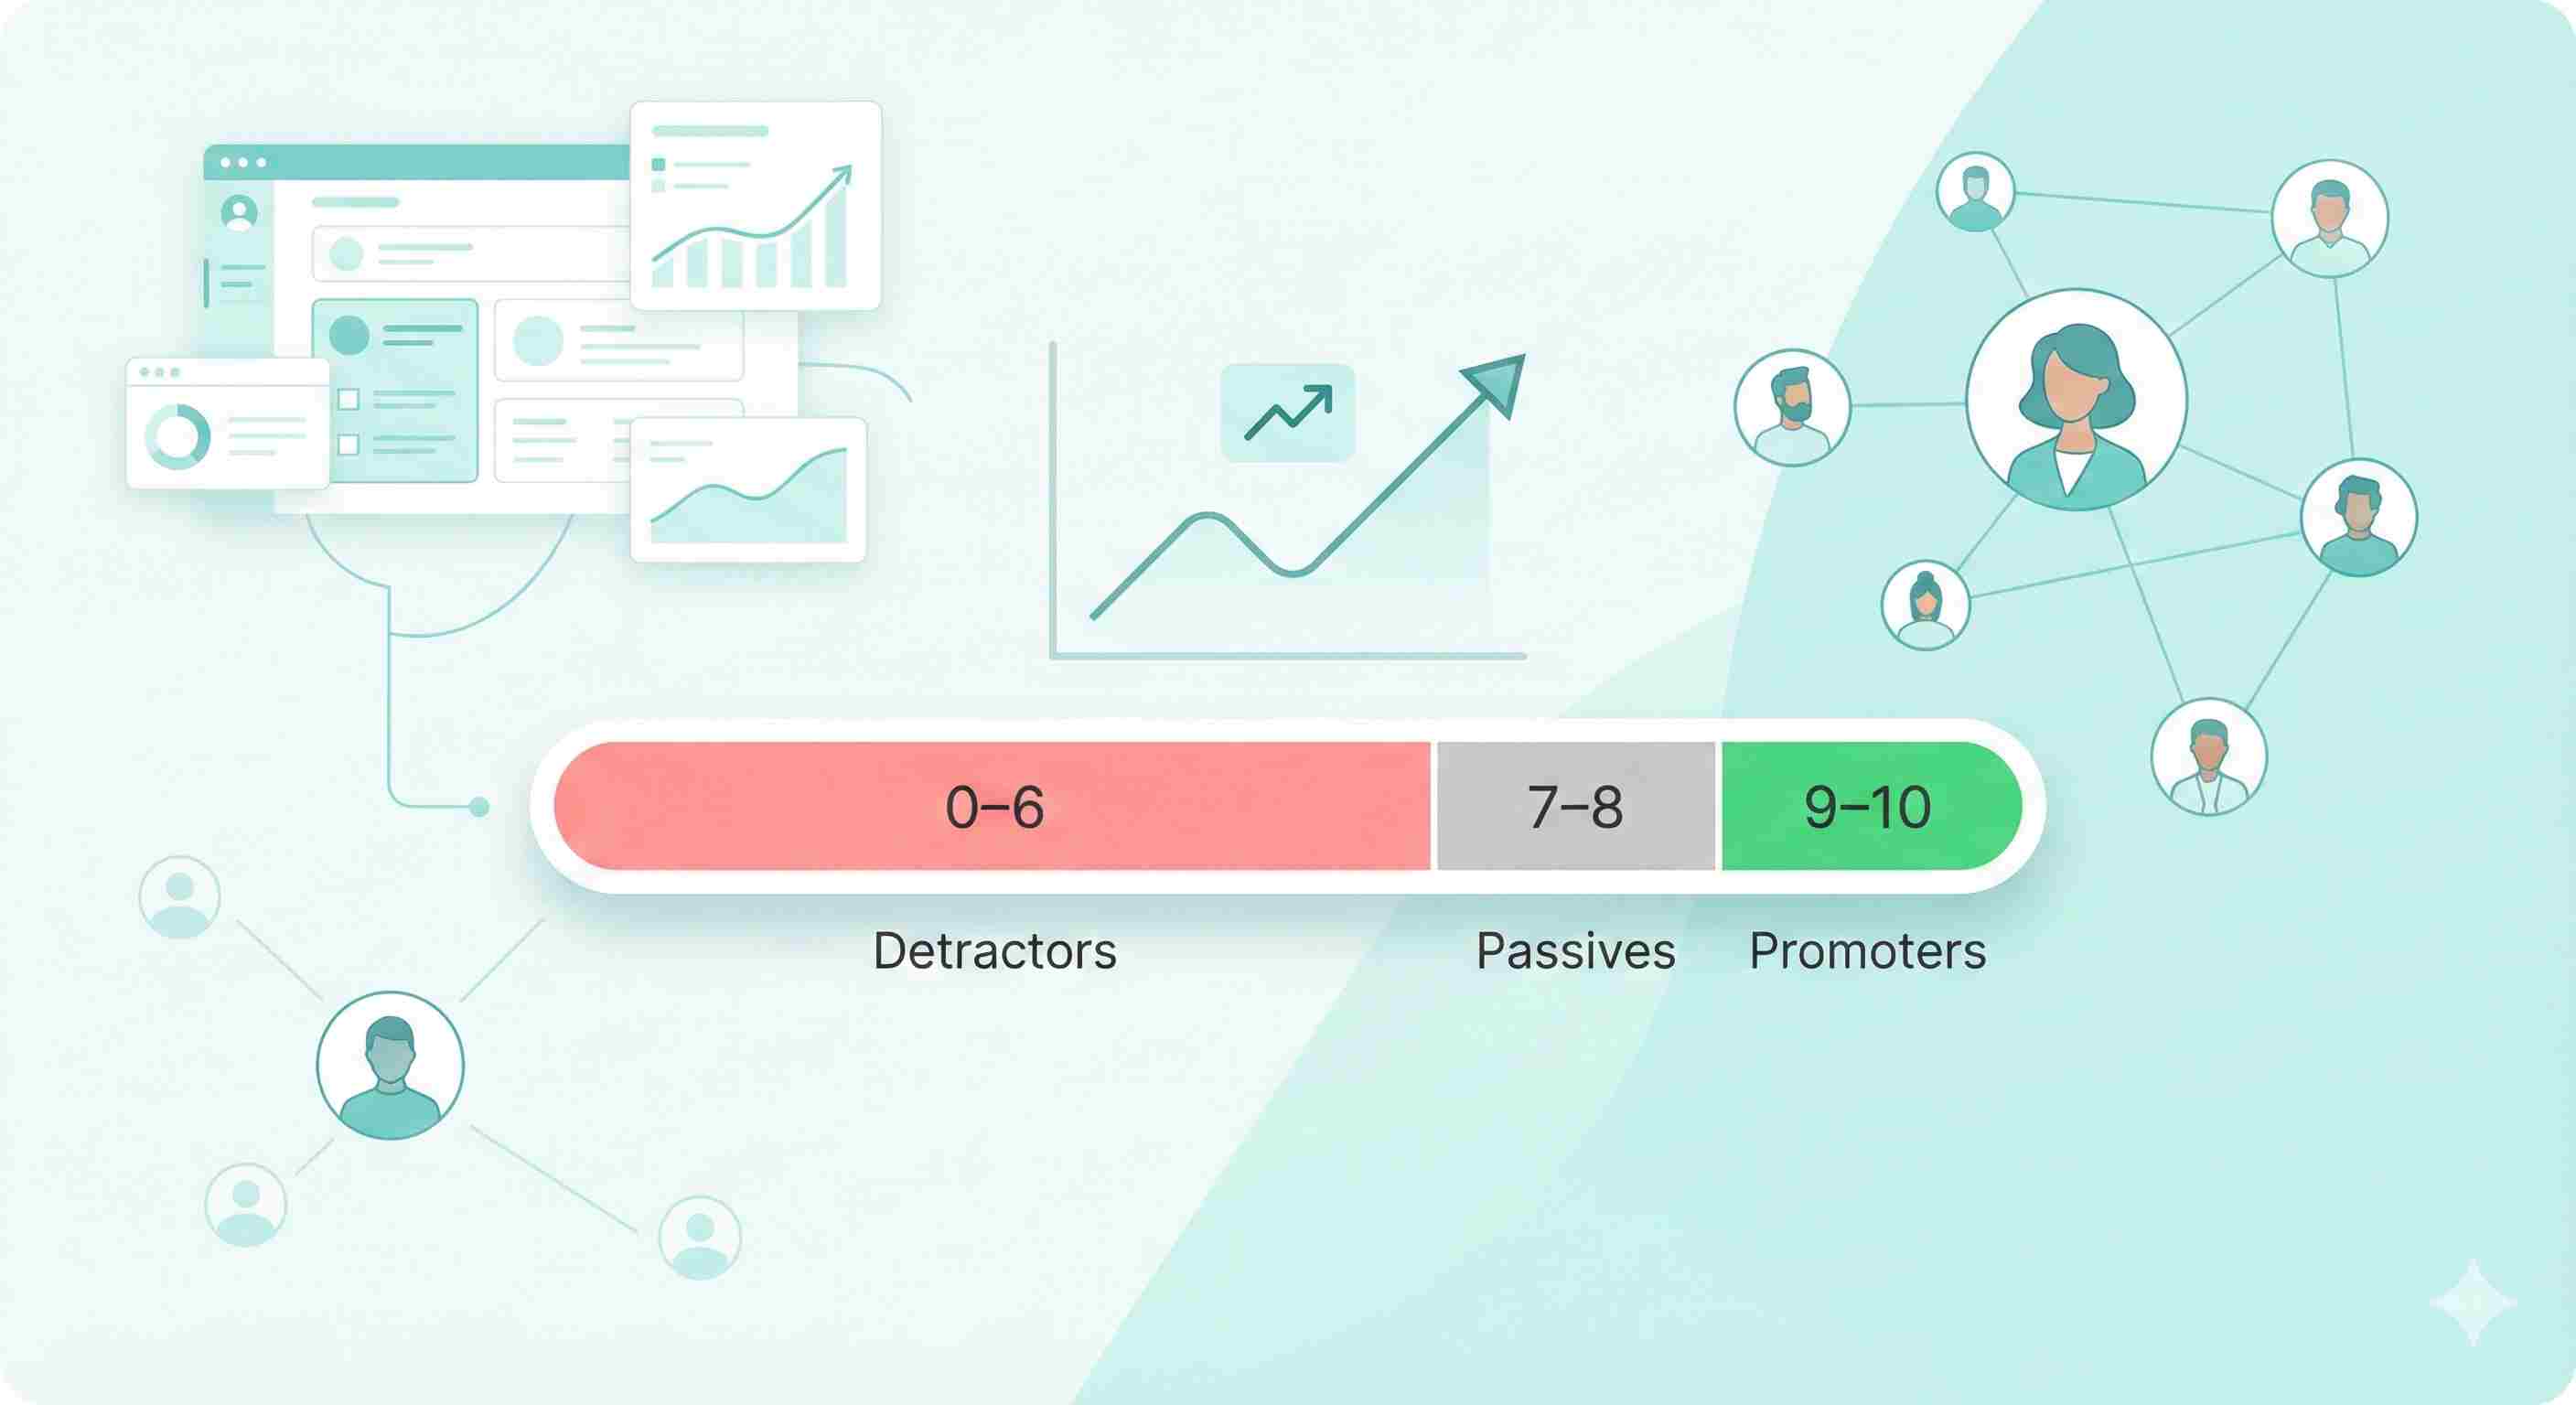
4. Net Promoter Score (NPS)
NPS asks "How likely are you to recommend us to a friend?" on a 0-10 scale.
It measures loyalty, not just satisfaction. Someone can be satisfied but not loyal enough to recommend you.
What good looks like: Above 50 is excellent. 30-50 is good. Below 30 needs work. B2B companies typically score higher than B2C.
How to improve it: Unlike CSAT, NPS reflects your entire relationship with the customer, not just support. But consistently great service moves the needle.
Follow up with detractors (scores 0-6) personally. They're at risk of churning.
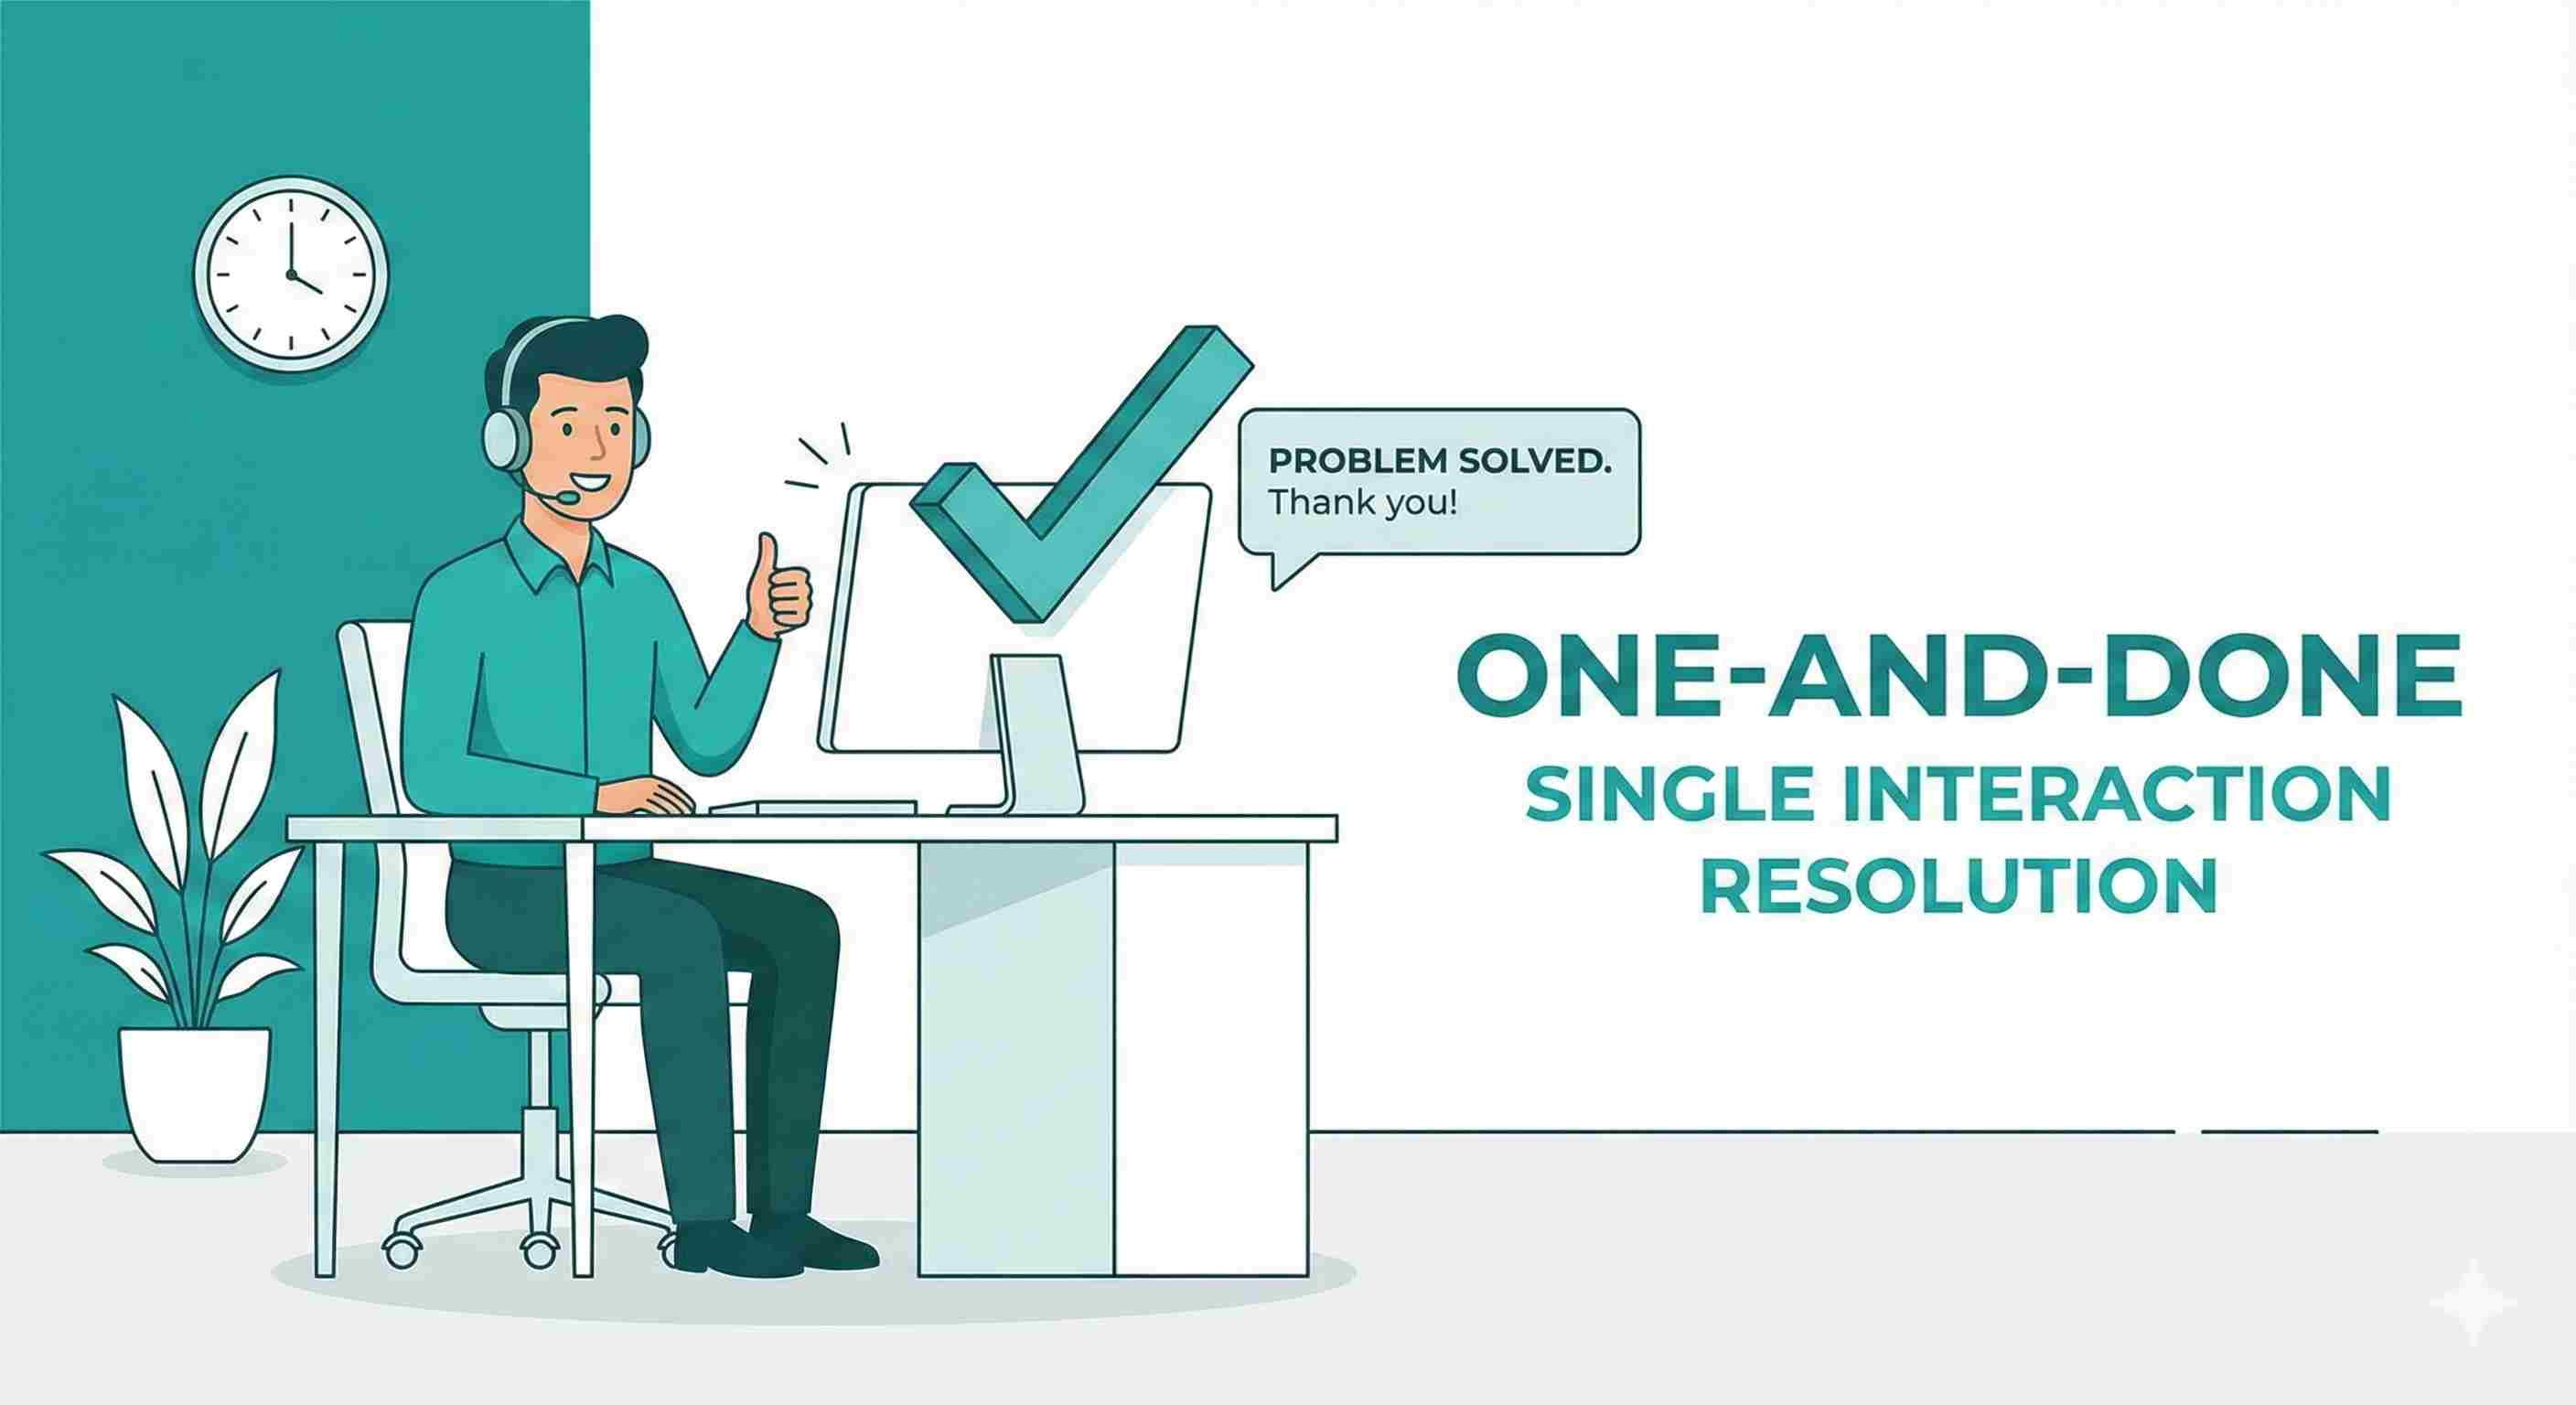
5. First Contact Resolution (FCR)
This tracks what percentage of issues get solved in the first interaction without follow-up.
High FCR means customers aren't bouncing between agents or channels. It saves everyone time and reduces frustration.
What good looks like: 70-75% is solid. Above 80% is excellent. Below 60% means agents lack training or tools.
How to improve it: Empower agents to make decisions without manager approval. Give them access to all customer data on one screen. Reduce transfers between departments.
Create specialists for complex issues instead of forcing every agent to handle everything poorly.
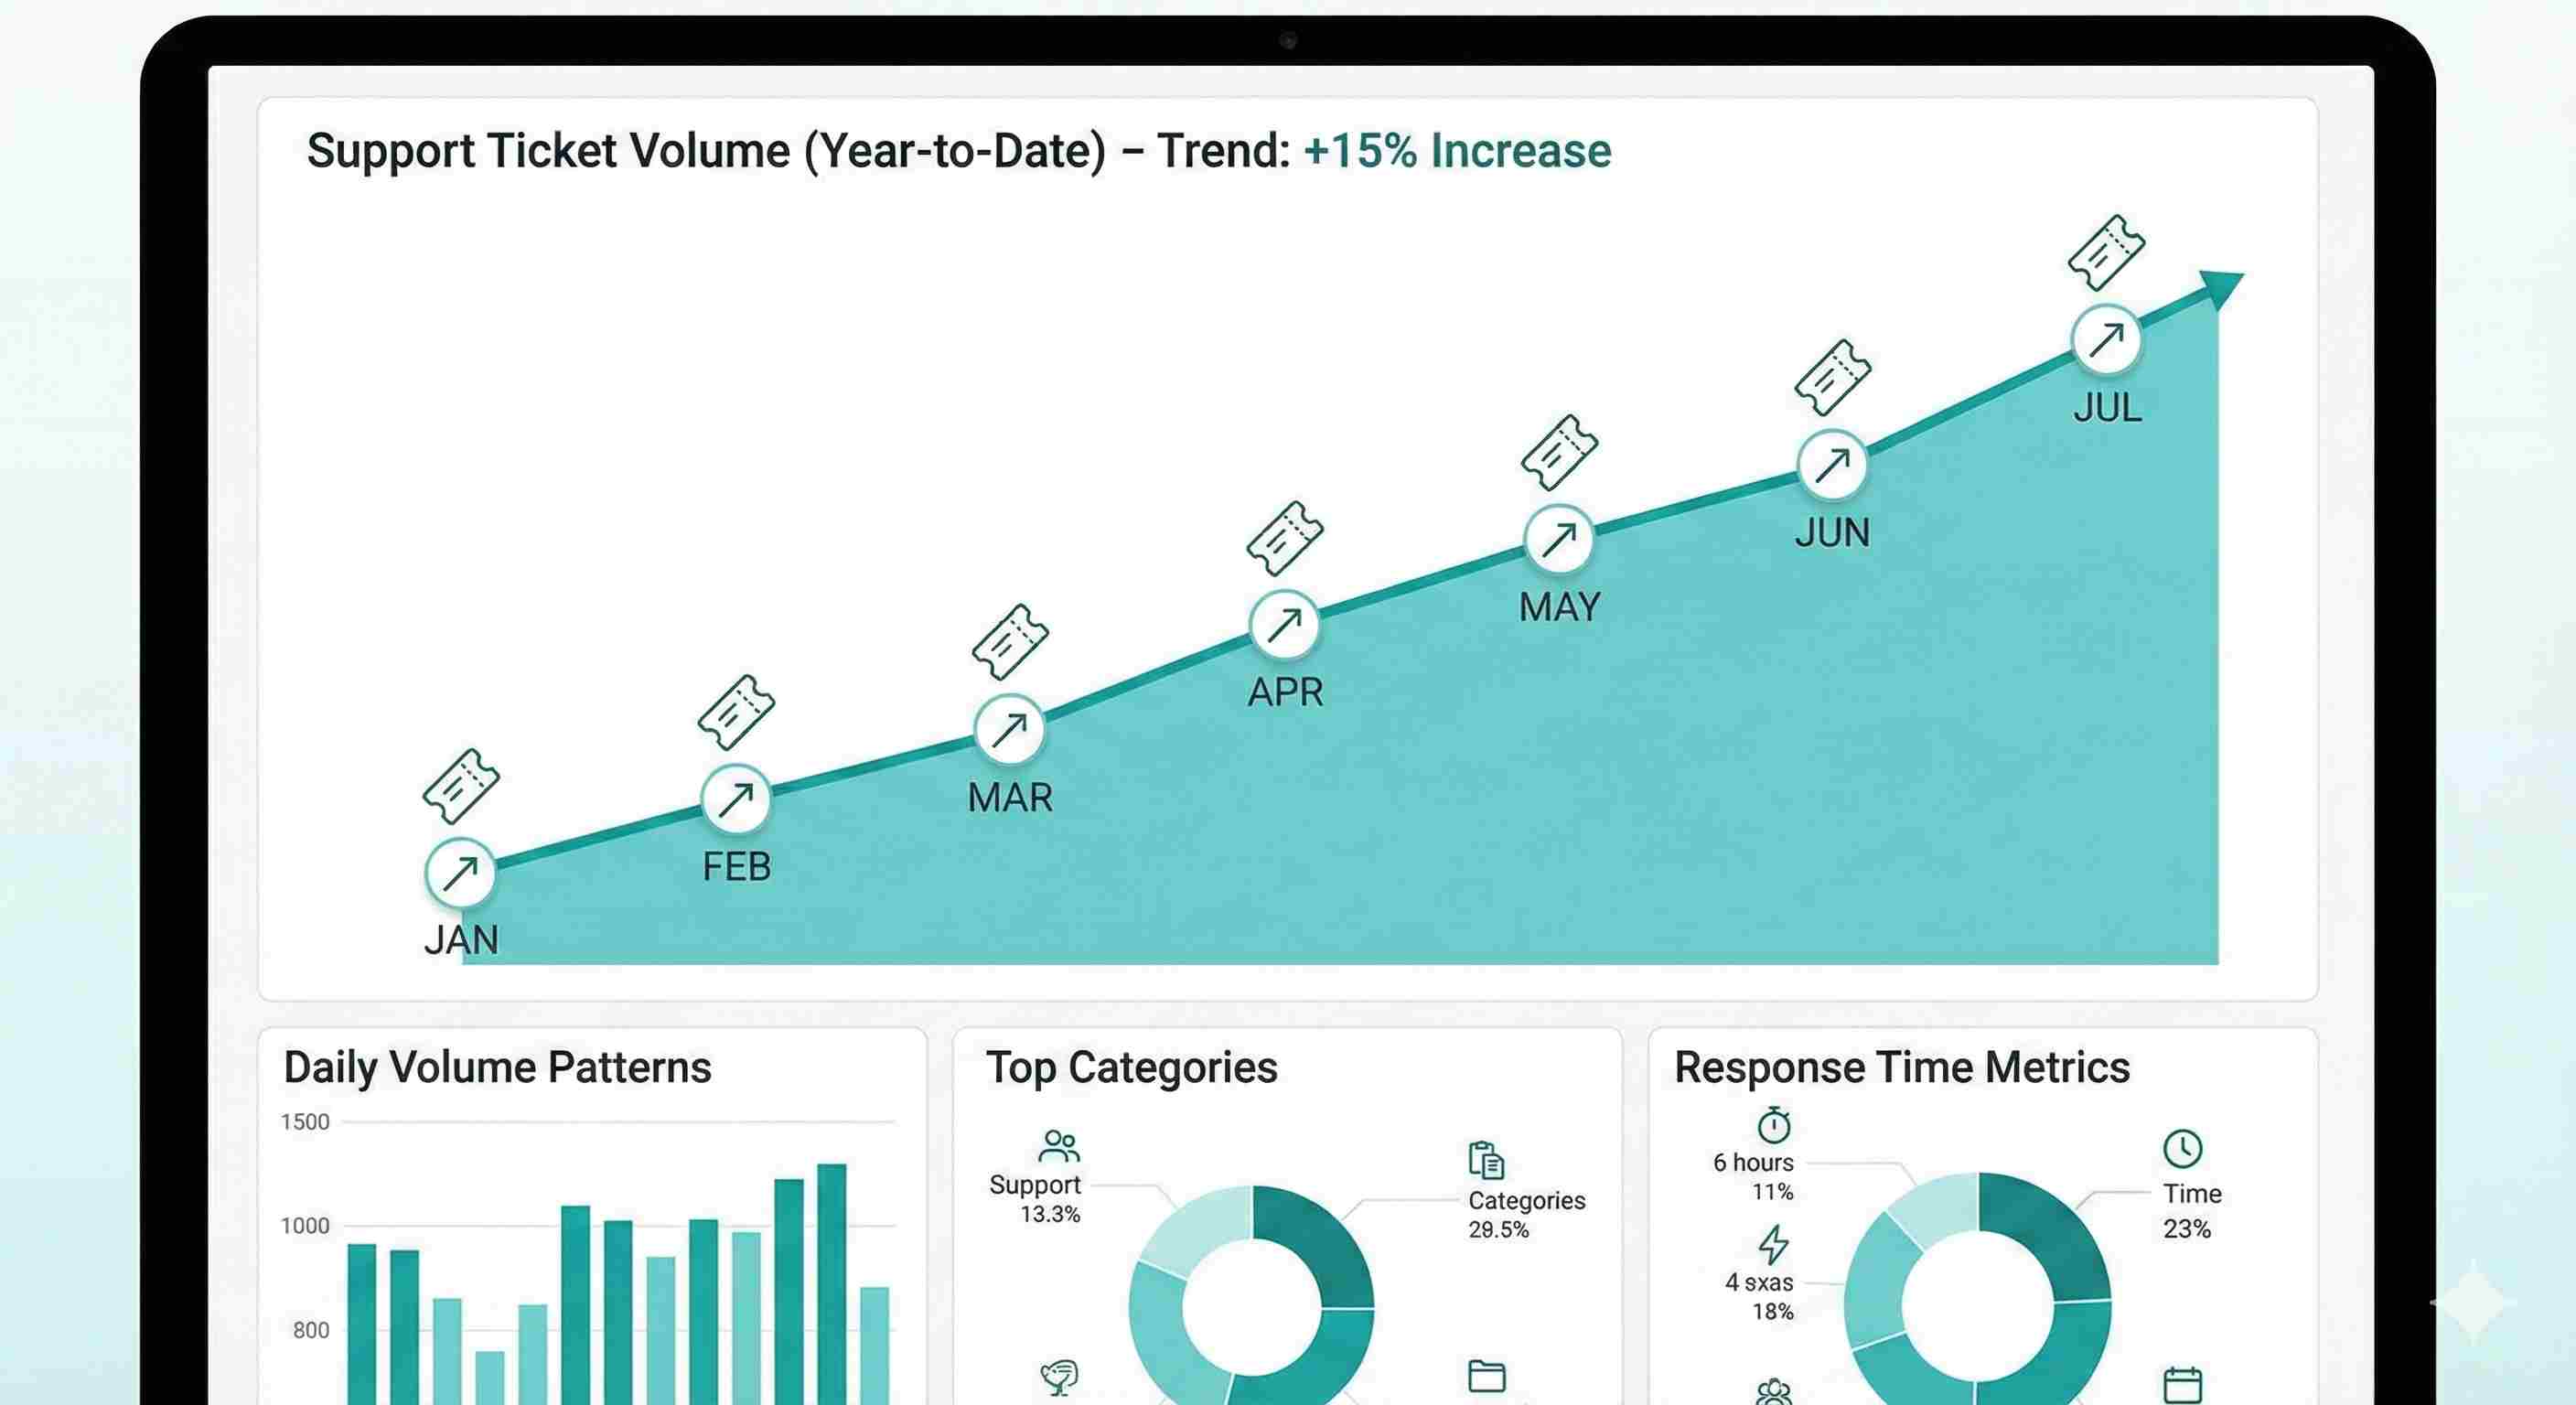
6. Ticket Volume Trends
Track how many tickets you're getting over time, broken down by category.
Growing ticket volume isn't always bad. If you're growing customers, tickets should grow too. But if tickets grow faster than customers, something's wrong.
What to watch for: Sudden spikes in specific categories signal problems. A 300% increase in password reset tickets? Your new login flow is confusing. Shipping complaints doubled? Your logistics partner is dropping the ball.
How to use it: Create a weekly report of top issue categories. Share it with the product and operations teams. Many support issues stem from problems elsewhere in the company.
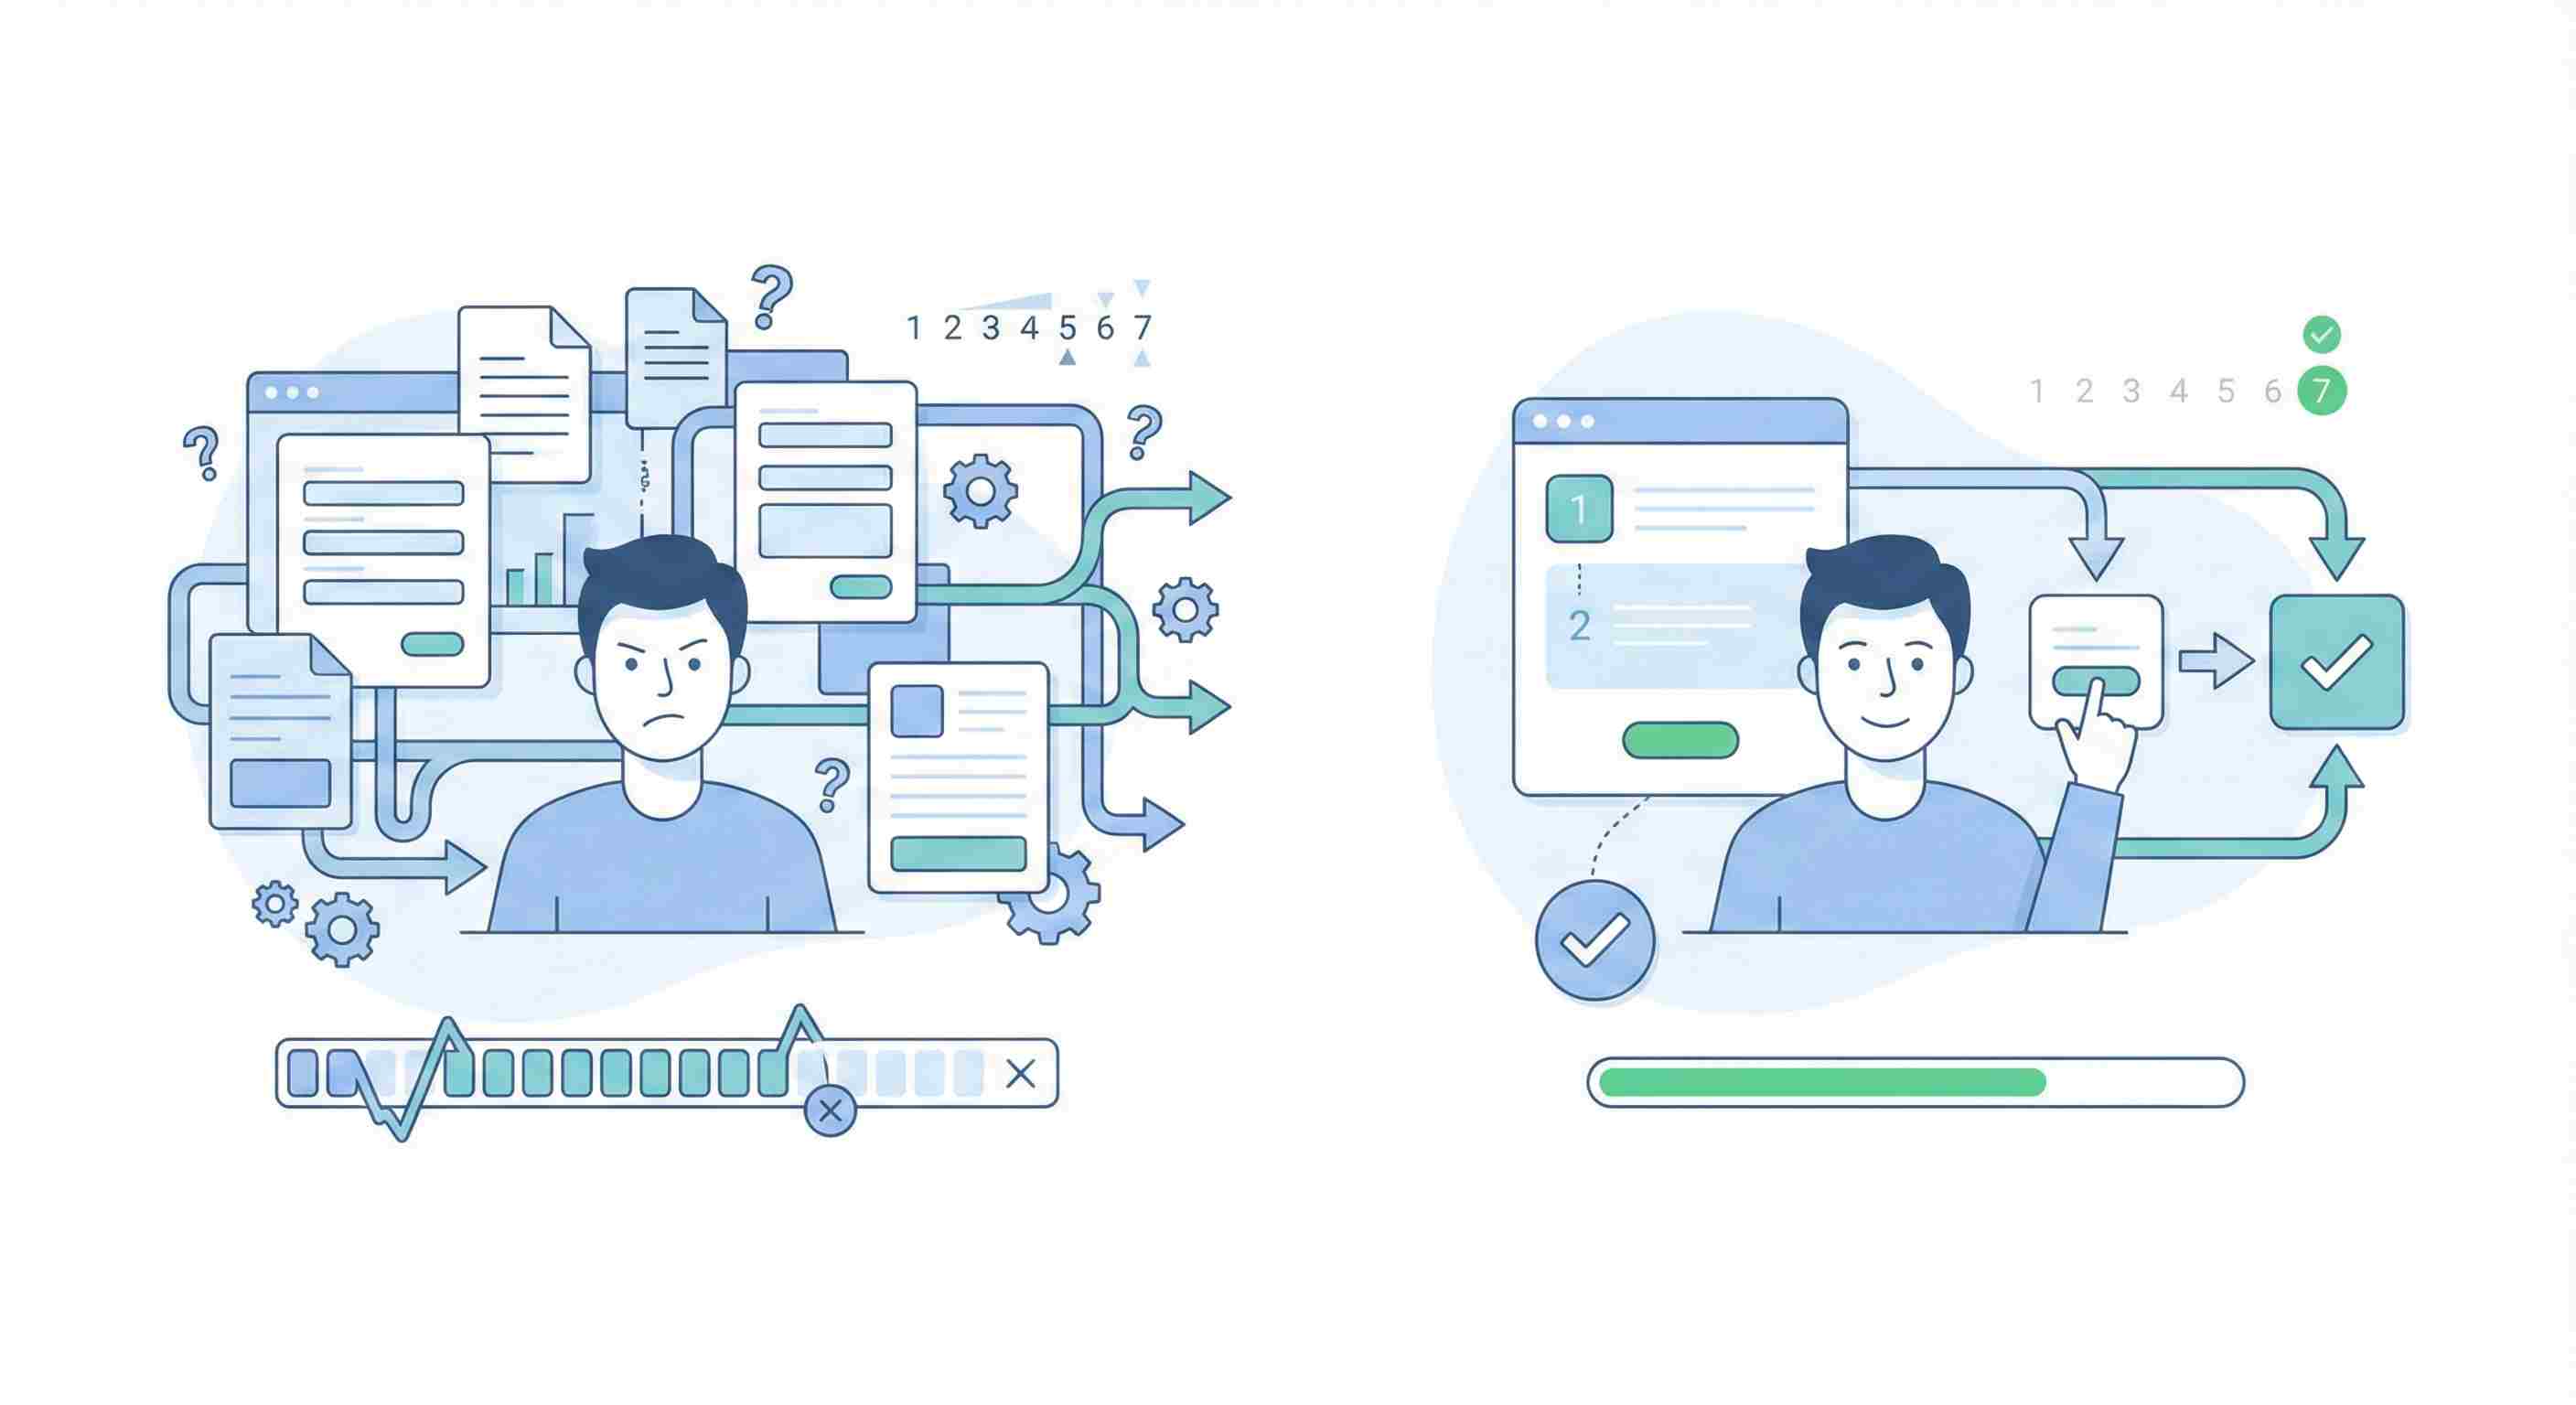
7. Customer Effort Score (CES)
This asks "How easy was it to handle your issue?" after an interaction.
Research shows reducing effort matters more than delighting customers. People just want their problems solved without jumping through hoops.
What good looks like: On a 1-7 scale, aim for an average above 5. More than 20% giving you a 1-3 means your processes are too complicated.
How to improve it: Map your customer journey and count the steps. Can you eliminate any? Do customers have to repeat information? Can they solve this themselves?
Add self-service options for common issues. Not everyone wants to talk to a human.
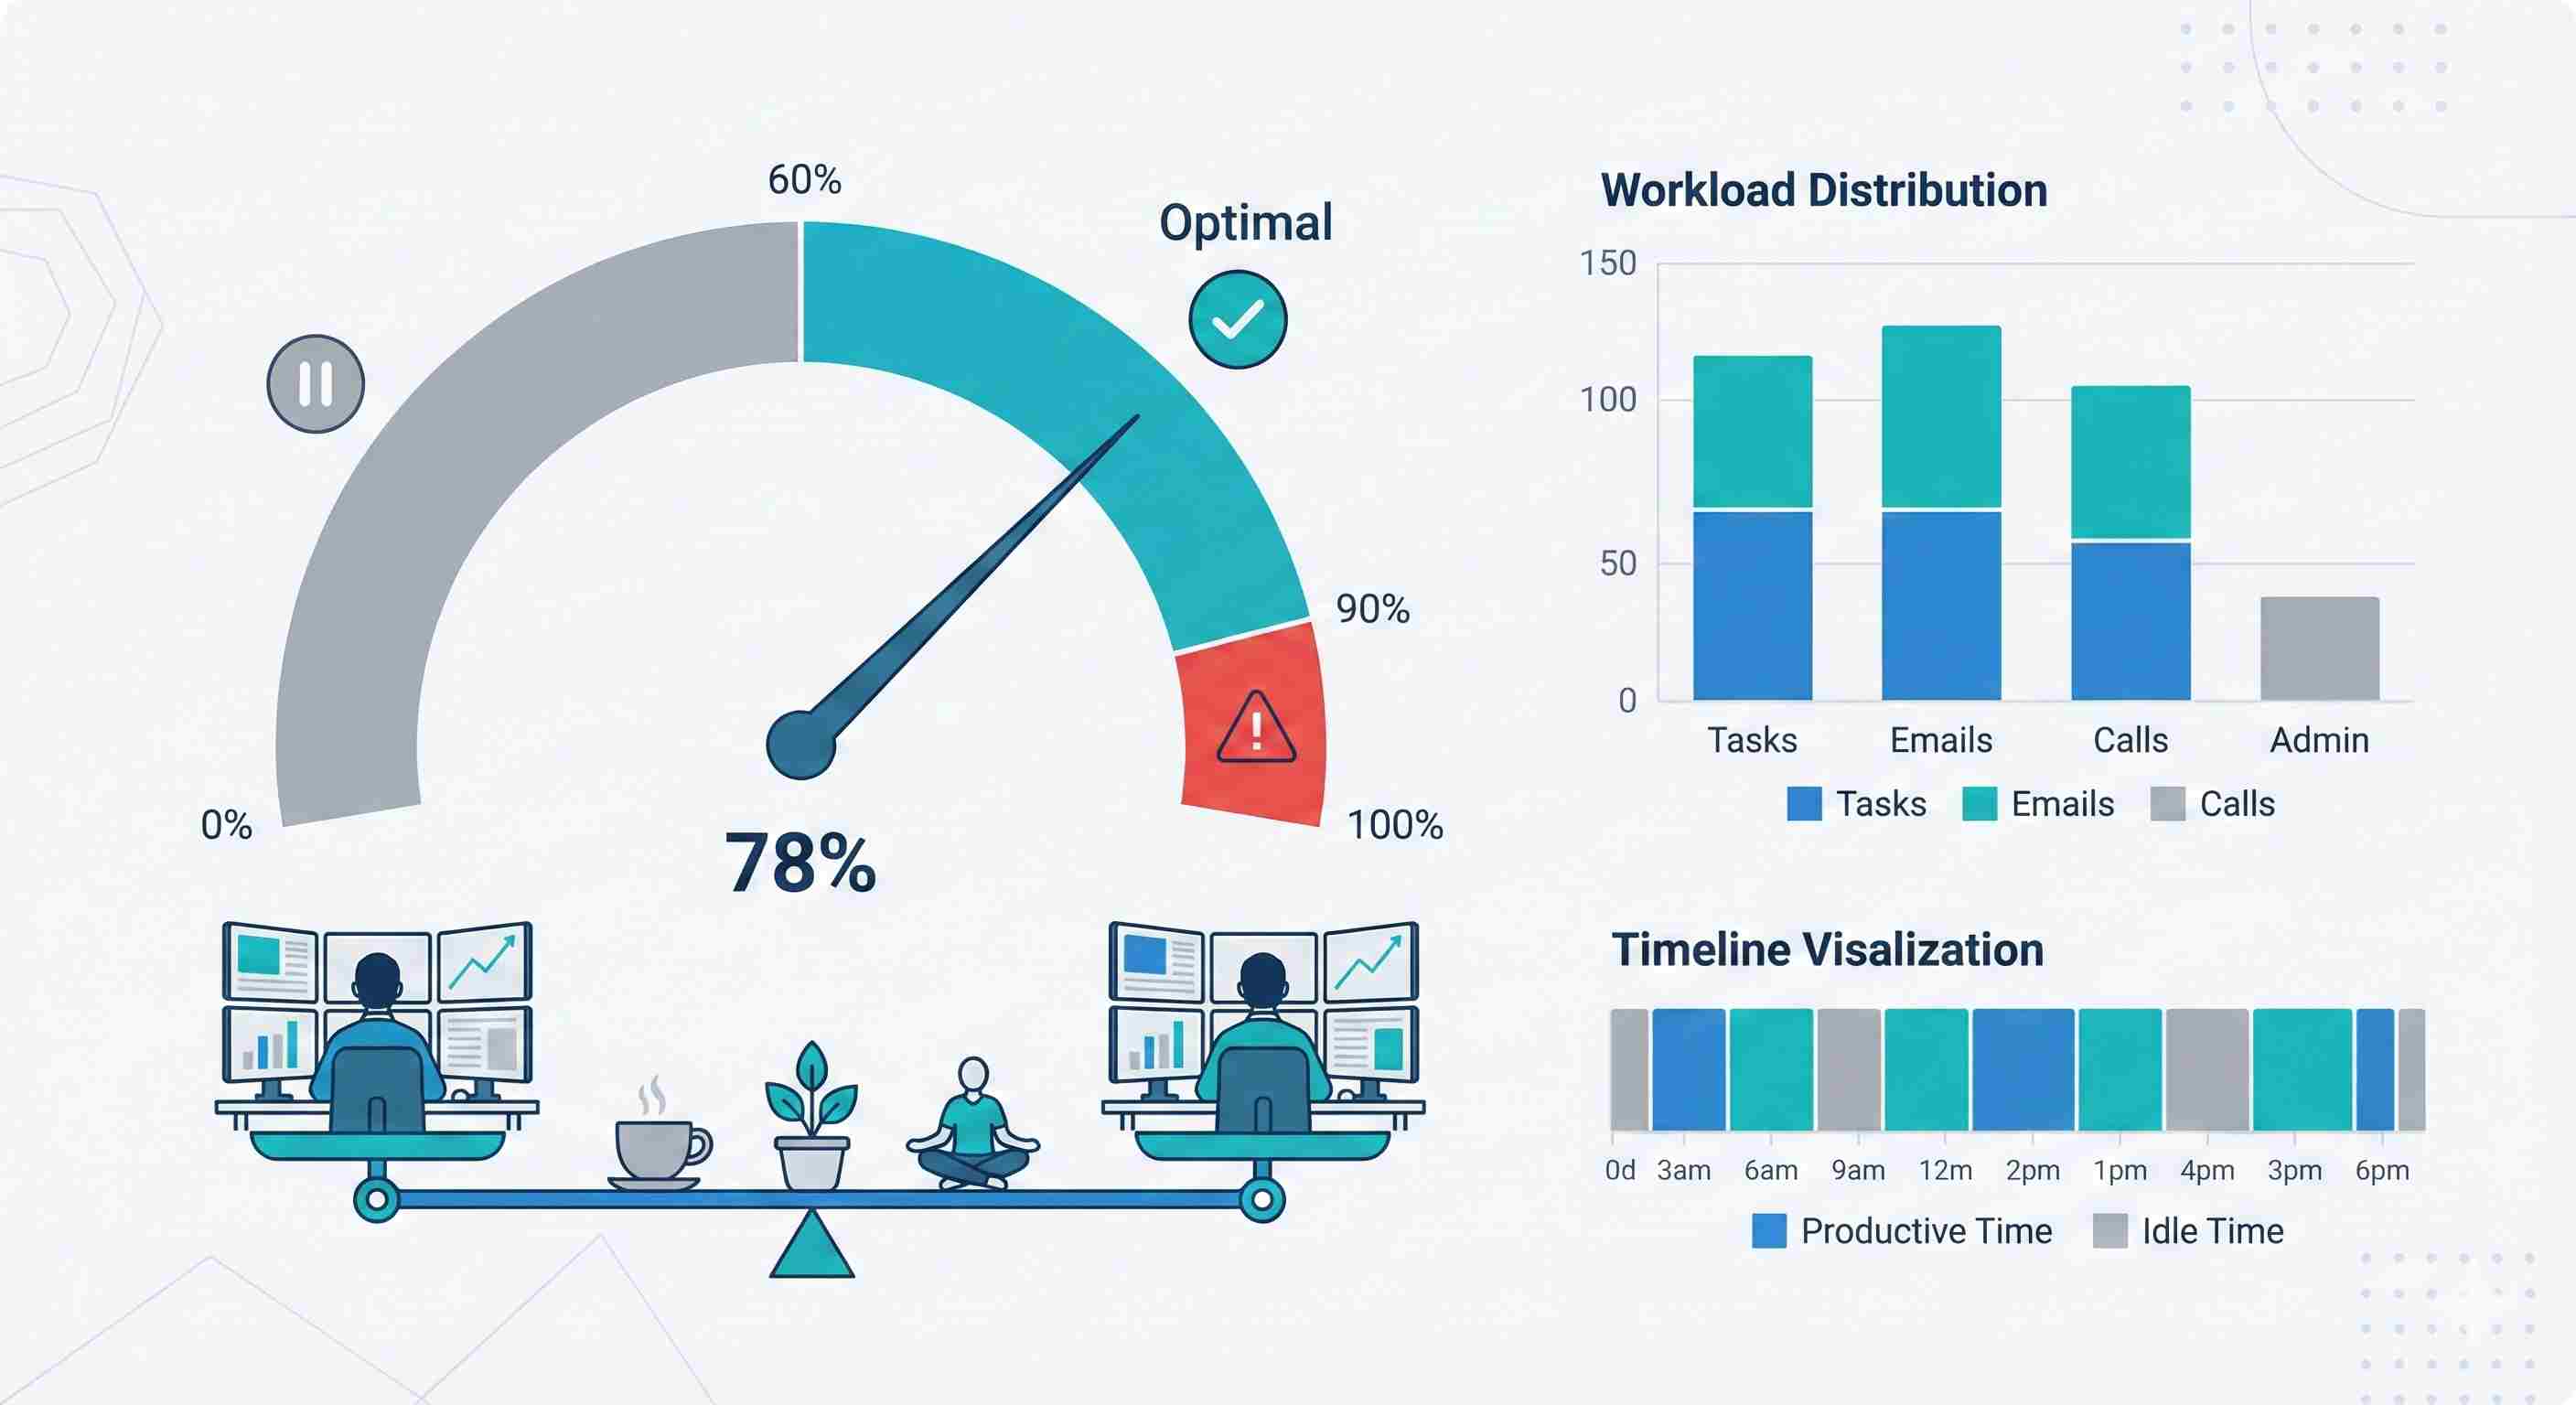
8. Agent Utilization Rate
This shows what percentage of an agent's time goes to productive work versus idle time.
You need this data to staff correctly. Too high utilization (above 90%) burns people out. Too low (below 60%) means you're overstaffed or have workflow problems.
What good looks like: 70-85% is the sweet spot. It leaves buffer time for coaching, breaks, and unexpected volume spikes.
How to improve it: Use workforce management software to forecast volume. Schedule agents based on historical patterns. Build in flex time for training.
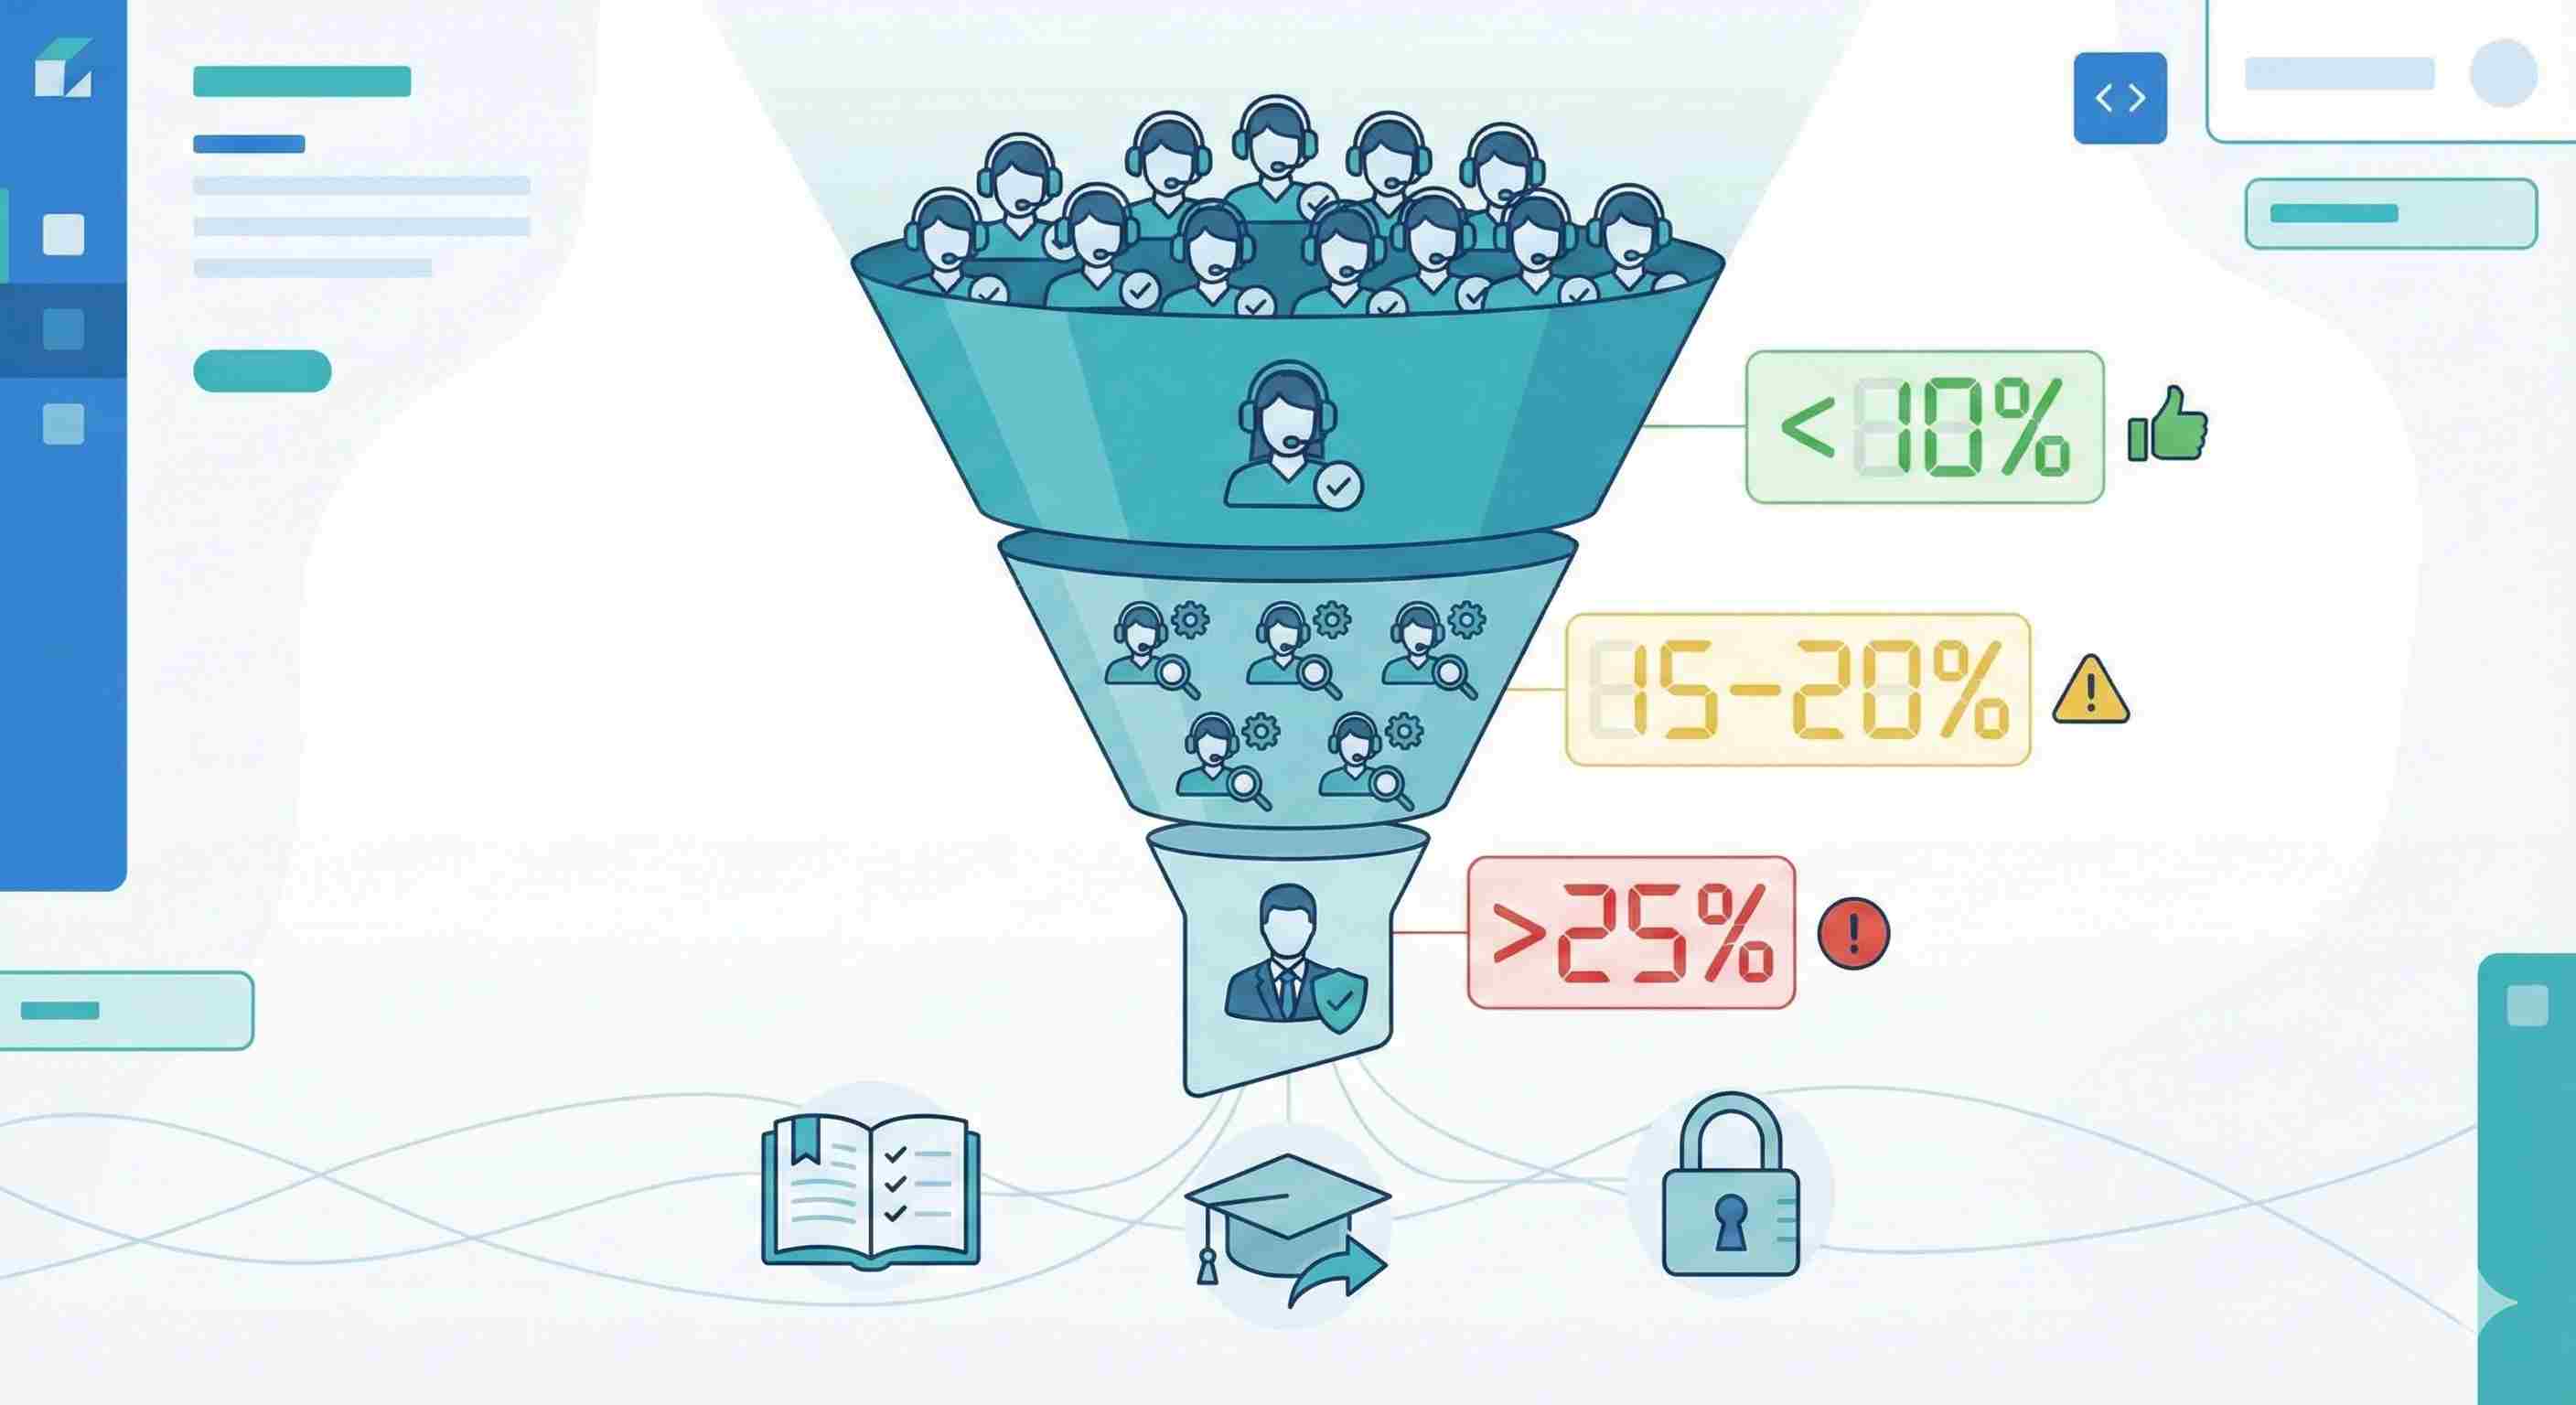
9. Escalation Rate
What percentage of tickets need manager or specialist intervention?
Some escalation is normal. But high rates mean frontline agents lack authority or knowledge.
What good looks like: Under 10% is solid. 15-20% suggests training gaps. Above 25% means you need to rethink your model.
How to improve it: Review escalated tickets monthly. Why did they escalate? Create runbooks for common scenarios. Expand agent authority to handle refunds or exceptions up to certain amounts.
The best managers work themselves out of the escalation queue.
10. Customer Churn Rate Correlated with Support Interactions
Track which customers who contacted support ended up canceling within 30, 60, or 90 days.
Not all support experiences are created equal. A billing dispute handled poorly might trigger cancellation even if your CSAT looked fine.
What to watch for: Customers who contact support multiple times in a short period are high-risk. So are those with unresolved tickets.
How to use it: Flag at-risk accounts for proactive outreach. If someone had three tickets in two weeks, have a manager call them. Get ahead of the cancellation.
Measure which issue types most strongly correlate with churn. These need extra attention.
Making Metrics Actually Useful
Tracking these numbers is the easy part. Using them well is harder.
Start with a dashboard. Don't make people dig through reports. Put key metrics where everyone can see them daily.
Set realistic targets. Industry benchmarks are helpful starting points, but your targets should reflect your specific situation. A luxury brand can afford longer response times than a budget competitor.
Review weekly, not monthly. Monthly reviews are too slow. By the time you spot a problem, it's been happening for weeks.
Connect metrics to actions. Every metric should have a "so what?" attached. If FRT is climbing, what are you doing about it? If CSAT drops for a specific issue, who's investigating?
Don't punish the messenger. If you hammer agents over metrics, they'll game them. Closed tickets that aren't actually resolved. Rushed conversations that hurt CSAT. Create a culture where bad numbers trigger problem-solving, not blame.
What About AI and Automation?
In 2026, you should absolutely be using AI tools. But track how they affect your metrics.
Is your chatbot actually resolving issues or just frustrating people who then contact a human anyway? That's not improving FCR, it's adding steps.
Are AI-suggested responses helping agents work faster or do they spend more time editing them than writing from scratch?
Measure the impact. AI is a tool, not a magic solution.
The Metric That Matters Most
If you only tracked one number, make it customer lifetime value (CLV) for customers who contacted support versus those who didn't.
Great support turns problems into loyalty. People remember how you treated them when things went wrong.
If your support customers have higher CLV, you're doing something right. If they're churning faster, your metrics might look good but your experience doesn't.
Start tracking these ten metrics this month. Pick three to focus on improving first. Once those stabilize, tackle the rest.
Track the Metrics That Actually Matter
Set up simple tracking and see how customer service performance improves over time.